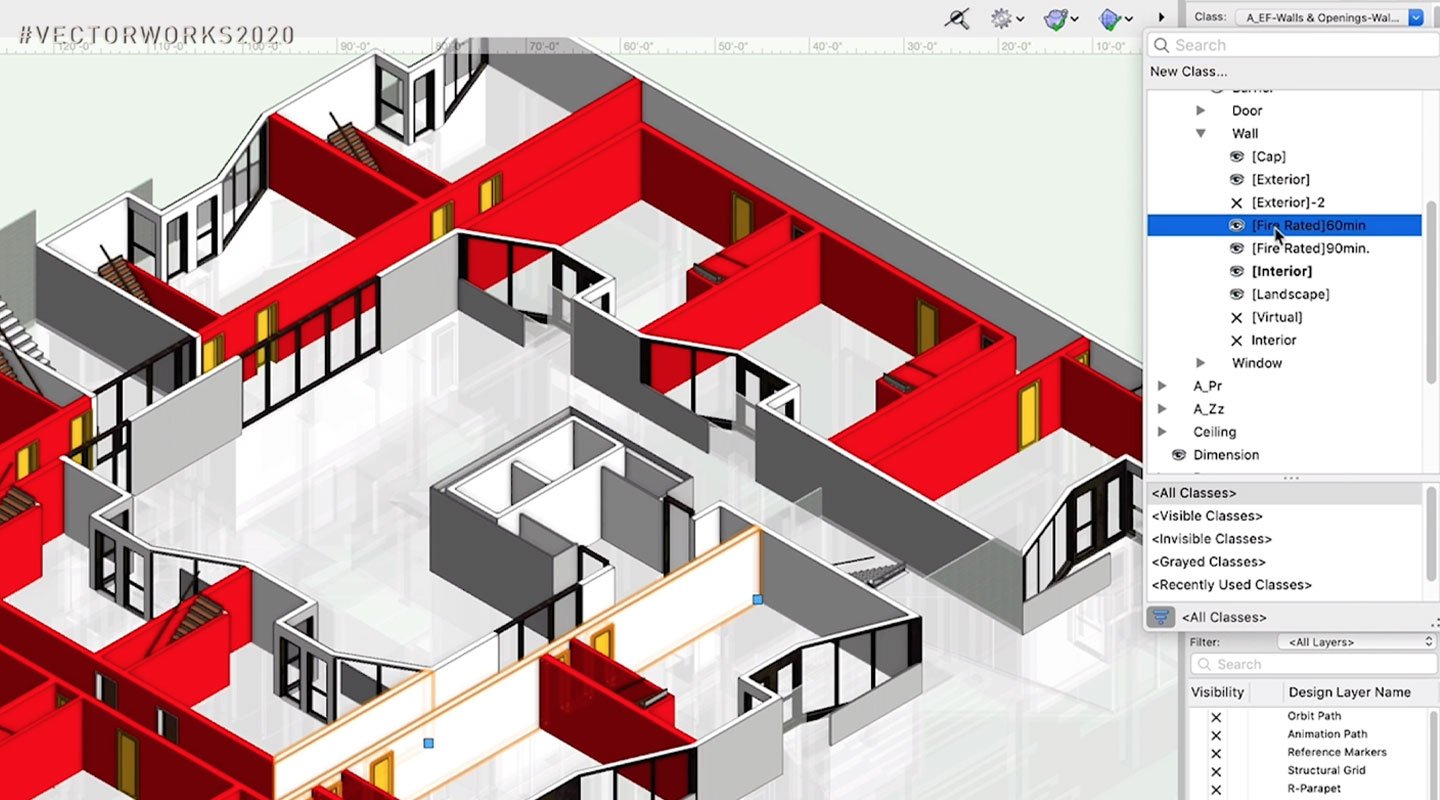
 Use the Object Info Palette (OIP) to see data visualizations or manage in the Data Visualizations dialog.
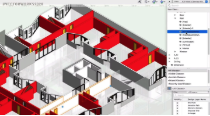
Data visualization first appeared in Vectorworks 2017, but back then it was confined to viewports. 2020 brings data to the forefront: right in the design layer where you make your design decisions. It’s a live working environment where you can accurately discern the impact of your data — an addition that goes a long way in designing intelligently.
“Data is information. Information is knowledge. And we know that knowledge is power,” explained Hugues Tsafak, director of product development.
This feature is a useful new way to make design changes and see their impact immediately — creating an all-together proactive design environment.